Today I was looking for an unobtrusive method of determining a user’s connection speed using JavaScript. A quick search on Google returned an array of tricks mostly having to do with using Ajax to make a call behind the scenes, and track the payload time for the small file. In most cases people use an image with a random variable at the end to avoid caching, like image.jpg?foo=1Rt2X21. This is all good but adds an HTTP connection which could potentially interfere with the user’s experience, especially if they are already on a slow connection to begin with.
Then I discovered something interesting in Google Analytics.
Google Analytics tracks and stores connection speeds for your visitors as part of the Network Properties category. The data provided includes Connection Speed and this corresponds with Pages per visit, Average time on Site, Percentage of new visits, and the Bounce rate. But how in the world does Google compile this data? It appears that people are guessing that Google uses the visitor’s IP address or hostname to do a lookup in an IP database or a reverse lookup, and then makes a guess based on what ISP that IP address belongs to. But Google also loads a small .gif file with each urchin request. This article explains a little trick for using time stamped image loading and log analysis which seems related.

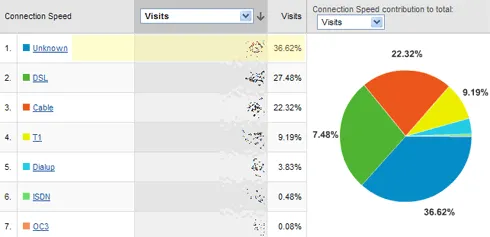
So if your IP belongs to RoadRunner, then we can assume you are on a cable connection and file you under that category. This can sometimes get somewhat hairy and lead to ambiguity as evidenced by the Unknown category shown in Google Analytics. It is also interesting to note the Unknown category is the single largest category in my case with 36% of the total data collected. What happens if you are on AOL or EarthLink? Will the database contain the accurate information to pinpoint if you are on dial-up or broadband? How often is the database updated with new information? What about edge cases, for example if you work in an office where you have a “broadband” connection but share it with a large group of people?
The good news is that with Analytics the work happens without interfering with the user experience and no additional HTTP connections are needed. The bad news is, it is not done in real time. So if you are looking for a real-time test this will not work for you, unless you build your own seriously fast IP database web service that you can use asynchronously. The other option is to use the binary image payload test, but that also makes life hard for your users.
So, If you are looking for general statistics for a webapp over a date range then Google Analytics might be the way to go. Keep in mind you will end up with a chunk of Unknown data. As for making snap decisions, you can sniff user bandwidth while they surf with payload testing. Here is another sample page at AOL where they put up a simple fork page and determine your bandwidth speed using JavaScript image loading and setting a user cookie. I can think of a dozen reasons why this is a bad idea but I won’t go into that here.
PS. It is worth mentioning that Internet Explorer supports a built in behavior called clientCaps, which provides information about features supported by Microsoft Internet Explorer, as well as a way for installing browser components on demand. The connectionType property of clientCaps returns either lan, modem or offline. Since this only works in IE and doesn’t offer too much granularity, it might be a good test if you are only trying to test IE users specifically.