Safari 3.1 features improvements to the functionality for the Web Inspector developers tool. In now has an improved console for working with JavaScript and DOM, DOM inspector with CSS support, a nice Network analysis tool and search all built in. It is somewhat comparable to the FireBug plugin for FireFox so I will also make some comparisons of their features.
Web Inspector Overview
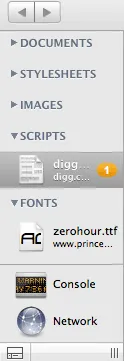
To get started open Web Inspector by going to Safari 3.1/Develop/Show Web Inspector and you will see the new window open up. The initial window is split up into a top row with navigation buttons and search box. The navigation buttons take you the the next and last actions you make within Web Inspector and come in handy when debugging. The left navigation lets you view and inspect the loaded web resources including Documents, StyleSheets, Images, Scripts, WebFonts, Databases and Other files, as well as buttons to load the Console and Network details. Ajax request and responses show up under the Other file category. If any errors are found, the number of errors are placed on the file name in the navigator. For example here, Safari has found 1 bug in the file diggthis.js The main content area shows you the web source details for viewing. JavaScript errors are marked with an orange pop, while HTML and CSS errors have a red color. If you want to attach Web Inspector to the bottom of your Safari Window click the small box on the bottom left corner of the window. I found this this to be a more usable placement.
DOM Editing
Clicking on any HTML Document on the left loads the source on the right. Documents can also be viewed as a DOM resrouce by clicking ont he DOM button on the top nav. (Note you have flip between DOM and Source view for HTML files.)
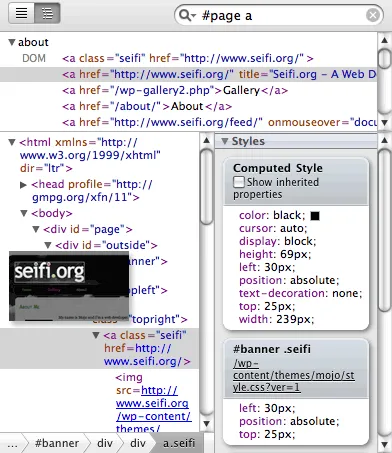
Searching supports DOM and CSS elements and you can nest your DOM element searches to filter out exactly what you’re looking for. For example #page a returns all anchor tags in the div with the page id. The corresponding display element in Safari is highlighted as you select DOM elements.
The right pane displays Styles, Metrics and Properties for seleted DOM elements. Styles show you both the computed style as well as all the defined style rules for that object. Like FireBug you can edit your CSS rules in real time in the Styles boxes for each CSS rule. To edit any CSS property double click the name or value and an edit box opens allowing you to type in your changes. This is great for testing out new ideas on the fly.
The metrics pane shows you the layout rules including offset, margin, border, padding, width and height for the element. Finally the Properties pane lists all of the DOM object properties that apply to the selected element.
Downloadable Web Fonts
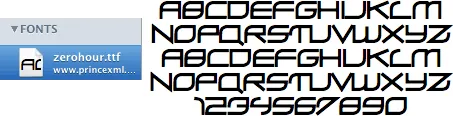
If you are using downloadable web fonts the Fonts file group shows you a rendering of all the fonts that are loaded into the user’s browser.
Client Side Databases
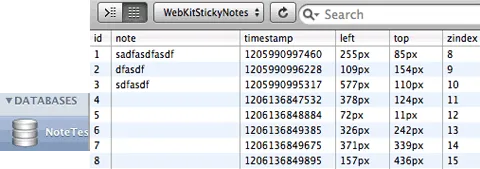
Also if you are using the client side database features of HTML5, the Databases category will let your explore the databases loaded in the client along with the all the tables and rows in each client side database. From here you can also execute SQL queries against the databases.
The Console
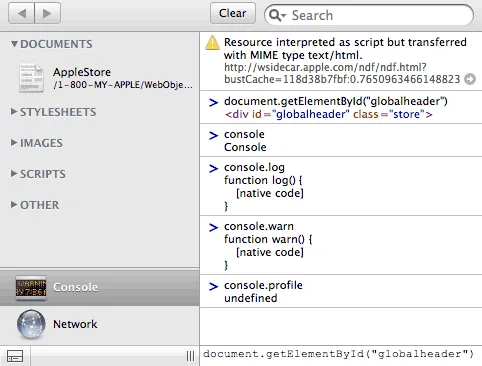
The console feature lets you type in JavaScript commands and view JavaScript errors, along with HTML and CSS rule errors. Clicking on any error jumps to the file, but unfortunately doesn’t go the corresponding line. The console has an input area for testing out JavaScript and DOM commands on the bottom. There is in fact a console object and my tests showed that Safari supports only a few of the functions for the console object. Here is a list of the FireBug console methods of which only a few are supported in Safari namely log, info, warn and error.
Supported methods: log info warn error Unsupported methods: debug assert dir dirxml trace group groupEnd time timeEnd profile profileEnd count
Network
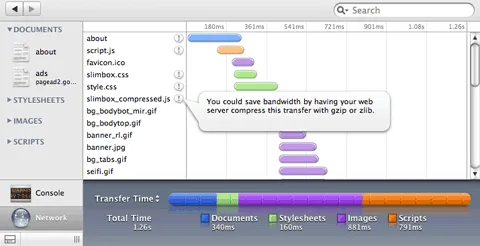
The network tab is actually quite nicely designed and show you what the transfer time or the transfer size for each resource and in total for the page. The capsule graph is color coded and breaks down the file types by Docs, CSS, Images, Script and Other. You can switch between time or size from the drop down. Web Inspector makes some suggestions as well for improving speed, for example here we see a recommendation to use file compression to save bandwidth. (I don’t really use this method now since IE6 is buggy with gzip deflation.) Click on any file to see the HTTP request and response header for that file.
Snippet Editor
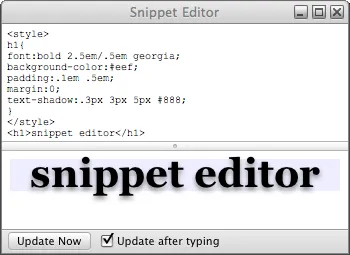
The Snippet Editor is a little utility that allows you to enter blocks of HTML and CSS and have it rendered on the fly. It is quite useful for testing out your CSS and Layout in little chunks.
Note: While using the Web Inspector and Snippet Editor, I came across numerous little annoying bugs and usability issues here and there. Also lots of features that I would expect are not there. For example you can not click on elements to inspect them, you can not add new style rules if they don’t exist already, and you can’t edit rules for CSS files loaded using @import. I would have to say that FireBug is a superior tool at this time for professional debugging, but Safari is about half way there.